العربية
News
TV
Companies
News
All News
Execlusive
Macroeconomy
Finance and Banking
Real Estate and Tourism
Healthcare and Education
Telecom and ICT
Energy
Automotive and Transportation
Industries
Retail and Consumables
TV
Prices Hub
Expert Talk
Interviews
Newsletters
Market Map
Data Bank
Listed Companies
MENA IPOs
Startups
Calendar
العربية
News
TV
Companies
Rights Issue Of El-Nile Co For Pharmaceuticals And Chemical 53.26
26.15 %
General Co for Land Reclamation 233.64
20 %
Wadi Kom Ombo 291.6
20 %
North Cairo Mills 96.86
20 %
Misr Oils & Soap 217
20 %
Middle Egypt Flour Mills 87.3
20 %
Saudi Egyptian Investment and Finance 137.05
20 %
Nile Pharmaceuticals 66.24
20 %
El Arabia for Land Reclamation 459
20 %
South Cairo & Giza Flour Mills 109.04
20 %
Alexandria Flour Mills 43.18
19.98 %
Middle & West Delta Flour Mills 502.01
12.91 %
Delta for Printing & Packaging 130.98
12.29 %
East Delta Flour Mills 330
12.03 %
Sheeni 14.2
10.94 %
Remas 1.97
10.67 %
Ismailia Poultry 12.24
10.17 %
First Investment 3.08
10 %
Speed Medical 0.37
8.19 %
Egypt Free Shops 30
7.57 %
Prime Holding 1.13
6.6 %
Lift Slab Misr 0.823
5.38 %
Arabia for Investment and Development 0.276
5.34 %
Pyramisa 152.33
5.22 %
International Business Corp 9.95
4.96 %
Upper Egypt Flour Mills 521.29
4.81 %
Integrated Engineering Group 0.525
4.58 %
Egyptian Modern Education Systems 0.464
4.5 %
Cairo Oils & Soap 0.328
4.46 %
PHDC 8.09
4.39 %
Egyptians for Housing 0.39
4.28 %
El Wadi International 1.24
4.2 %
Misr Chemical Industries 33.54
4.1 %
Remco 3.9
4 %
Suez Canal Co for Technology Settling 211.72
3.99 %
Gogreen for Agricultural Investment 1.32
3.94 %
Extracted Oils 4.22
3.94 %
Sharkia National Food 8.93
3.84 %
Egypt for Poultry 6.9
3.76 %
National Printing 23.15
3.63 %
Industrial and Engineering Projects 0.346
3.59 %
Mansoura Poultry 1.77
3.51 %
Gemma 32.17
3.37 %
Arabia Investments Holding 0.312
3.31 %
Giza General Contracting 0.594
3.3 %
NUDAP 2.65
3.11 %
Kima 11.2
3.04 %
Arab Valves 5.85
2.99 %
Rakta 28
2.9 %
Trans Oceans Tours 0.036
2.86 %
Juhayna 27.12
2.81 %
Bonyan for Development and Trade 4.53
2.72 %
A Capital Holding 4
2.56 %
Osool Brokerage 1.2
2.56 %
Cairo For Investment And Real Estate Development 14.41
2.56 %
International Agricultural Products 21.05
2.48 %
Alexandria Pharmaceuticals 665
2.48 %
El Ahram for Packing 9.36
2.41 %
Ajwa 128.01
2.41 %
Egyptians for Investment 0.259
2.37 %
EGYFERT 196.09
2.36 %
Fawry 13.8
2.3 %
Gharbia Islamic Housing Development 32.71
2.25 %
Goldentex 37.51
2.21 %
Memphis Pharmaceutical 141.02
2.17 %
Suez Canal Bank 24.75
2.02 %
Fitness Prime 1.52
2.01 %
Aspire Capital 0.315
1.94 %
Lecico 26.06
1.92 %
Egyptian Resorts 8.48
1.92 %
Arab Polvara 9.15
1.89 %
EAC 3.87
1.84 %
Raya Contact Center 7.34
1.8 %
Al Ahly for Development and Investment 32.57
1.78 %
Certificates Of Odin Egyptian Equity Investment Fund-KASAB 5.74
1.77 %
Alexandria National for Financial Investment 59.7
1.72 %
Heibco for commercial investments & real estate development 4.84
1.68 %
El Dawlia Fertilizers 29.48
1.66 %
Kabo 5
1.63 %
Nozha International Hospital 9.79
1.56 %
Egyptian Iron & Steel 29.45
1.55 %
Minapharm Pharmaceuticals 237.48
1.55 %
ADCO 168
1.54 %
Misr Hotels 26.28
1.47 %
Arab Aluminum 15.88
1.47 %
Orascom Development Egypt 23.18
1.44 %
E-finance 13.89
1.39 %
New Ismailia Urban Development 30.82
1.38 %
ACC 40.71
1.34 %
Development & Engineering Consultants 58.55
1.32 %
GB Auto 25.5
1.31 %
EIPICO 54.7
1.3 %
General Co for Silos & Storage 258.25
1.3 %
Ibnsina Pharma 10.78
1.22 %
Egytrans 5.9
1.2 %
Housing & Development Bank 65
1.17 %
EFG Hermes 26.09
1.12 %
Barbary Investment Group 0.183
1.1 %
ARAB Developers Holding 0.19
1.06 %
Digitize for Investment And Technology 6.84
1.03 %
Taaleem Management Services 10.3
0.98 %
El Obour Real Estate Investment 16.66
0.97 %
Egypt Aluminum 159.6
0.96 %
Madinet Nasr Housing 4.3
0.94 %
Elsaeed Contracting 1.09
0.93 %
Abu Qir Fertilizers 52.59
0.92 %
Reacap 7.7
0.92 %
Mena Touristic Investment 4.69
0.86 %
Emaar Misr 8.34
0.85 %
TMG Holding 55.46
0.84 %
Misr Beni Suef Cement 160.51
0.83 %
Amer Group 1.3
0.78 %
Naeem Holding 0.13
0.78 %
Zahraa Maadi 4.04
0.75 %
U Consumer Finance 8.3
0.73 %
Nasr Company for Civil Works 7.91
0.64 %
Media Production City 33.21
0.64 %
Heliopolis Housing 9.96
0.61 %
Arab Co. for Asset Management And Development 1
0.6 %
Contact Financial Holding 5.3
0.57 %
EGX 30 INDEX ETF 40.7
0.57 %
Al Moasher 3.58
0.56 %
Domty 20.24
0.55 %
Sidi Kerir Petrochemicals 19.13
0.53 %
Orascom Construction 389.99
0.51 %
Al Baraka Bank 12.75
0.47 %
Foodico 92
0.44 %
Oriental Weavers 22.7
0.44 %
Edita 17.1
0.41 %
El Kahera El Watania Investment 79
0.32 %
Delta Sugar 51.96
0.29 %
Acrow Misr 92.14
0.28 %
The United Bank 14.1
0.28 %
AMOC 7.4
0.27 %
Egyptian Financial & Industrial 180.9
0.2 %
Kafr El Zayat Pesticides 9.79
0.2 %
Abu Dhabi Islamic Bank 21.2
0.19 %
Al Khair River For Development Agricultural Investment&Envir 0.568
0.18 %
Kahira Pharmaceuticals 216.3
0.18 %
Obour Land for Food Industries 20
0.15 %
QNB Alahli 29.89
0.1 %
Faisal Islamic Bank of Egypt 0.992
0.1 %
Elsewedy Electric 75.06
0.08 %
Egyptians Real Estate Fund Certificates 13.16
0.08 %
SODIC 14.95
0.07 %
MOPCO 27.51
0.04 %
Glaxo SmithKline 54.93
0.04 %
Arab Engineering Industries 1.95
0 %
Arab Dairy 2.86
0 %
Raya 3.17
0 %
ICMI 4.28
0 %
Electro Cable 2.75
0 %
Rights Issue Of Premium HealthCare Group -1 0
0 %
TAWASOA For Factoring 0
0 %
HEDGESTONE Investment 0
0 %
SOLARSOL For Energy 0
0 %
Al Safwa Hospital 0
0 %
Utopia 0
0 %
Egyptian Warehouses 0
0 %
EGYSTONE 0
0 %
Rights Issue of International Agricultural Products -2 0
0 %
National Drilling 0
0 %
Qalaa for Financial Investments LLC 0
0 %
Marsa Marsa Alam 0
0 %
El Shams Pyramids 0
0 %
Golden Pyramids Plaza 0
0 %
Hassan Allam Investment Venture Capital 0
0 %
Catalyst Parteners Middle East –CPME 0
0 %
Arafa Holding 0
0 %
Saudi Egyptian Investment & Finance 0
0 %
Incolease 0
0 %
Delta Insurance 0
0 %
SAIB 0
0 %
Banque Du Caire 0
0 %
Geos for trading and contracting 0
0 %
Damietta Containers & Cargo 0
0 %
Port Said Container and Cargo Handling 0
0 %
Middle East Glass 0
0 %
Ferchem 0
0 %
Simo 0
0 %
KORRA 0
0 %
Arab Land Direct Mutual Fund 0
0 %
United Arab Stevedoring 0
0 %
Ezz Steel 0
0 %
Egysacom 0
0 %
Lakah Group 0
0 %
Suez Cement 0
0 %
Tourah Cement 0
0 %
Sohag National 0
0 %
DIFCO2 0
0 %
Global Telecom 0
0 %
Advanced Pharmaceutical Packaging 0
0 %
NBK 0
0 %
Alexandria Cement 0
0 %
Modern Company for water proofing (Bitumode) 0
0 %
Egyptian Company for International Touristic Projects 0
0 %
Modern Shorouk Printing & Packaging 0
0 %
Pachin 0
0 %
Delta Construction & Rebuilding 0
0 %
Nile Cotton Ginning 0
0 %
Al Ezz Dekheila Steel 0
0 %
Rowad Misr 0
0 %
Al Rowad 25.21
-0.04 %
Alex Cont 21.36
-0.09 %
Rubex 10.71
-0.09 %
Unipack 0.838
-0.12 %
Iron And Steel for Mines and Quarries 5.49
-0.18 %
SPINALEX 9.88
-0.2 %
Export Development Bank of Egypt 19.65
-0.2 %
Credit Agricole 18.62
-0.27 %
Maridive 0.36
-0.28 %
Al Fanar Construction 3.54
-0.28 %
Meatello 3.46
-0.29 %
Beltone Financial Holding 3.14
-0.32 %
Egyptian Kuwaiti Holding-EGP 24.99
-0.32 %
Cairo Poultry 19.33
-0.36 %
Egyptian Gulf Bank 0.264
-0.38 %
United Co for Housing 10.09
-0.39 %
Gadwa for Industrial Development 6.95
-0.43 %
Sharm Dreams 17.22
-0.46 %
Faisal Islamic Bank of Egypt 29.26
-0.51 %
Al Shams Housing 7.67
-0.52 %
Cairo Educational Services 42.41
-0.56 %
Egypt Kuwait Holding 0.711
-0.56 %
Odin Investments 1.65
-0.6 %
Arab Moltaqa Investments 3.28
-0.61 %
Gulf Canadian Real Estate Investment 1.64
-0.61 %
ICON 25.63
-0.66 %
B Investments Holdings 29.88
-0.66 %
Rekaz Holding 2.94
-0.68 %
Rameda 4.28
-0.7 %
Taqa Arabia 12.59
-0.71 %
ASCOM 36.48
-0.76 %
NileSat 6.56
-0.76 %
Eastern Co 38.7
-0.77 %
El Badr Investment and Development-BID 1.25
-0.79 %
Orascom Investment Holding 1.16
-0.85 %
M T I 8.2
-0.85 %
El Orouba Securities Brokerage 1.14
-0.87 %
Pioneers Properties 3.36
-0.88 %
CIB 97.13
-0.88 %
Real Estate Egyptian Consortium 1.08
-0.92 %
Canal Shipping Agencies 29.03
-0.92 %
Vertika 2.1
-0.94 %
Arab Cotton Ginning 8.16
-0.97 %
Telecom Egypt 46.33
-0.98 %
AT Lease 4.02
-0.99 %
Cleopatra Hospital 8.76
-1.13 %
Ataqa 11.65
-1.19 %
National Real Estate Bank for Development 0.98
-1.21 %
ALICO 2.43
-1.22 %
Act Financial 3
-1.32 %
Qalaa Holdings 2.8
-1.41 %
Orascom Financial Holding 0.69
-1.43 %
Egypt Gas 44.55
-1.44 %
Medical Packaging 1.31
-1.5 %
CI Capital Holding 7.11
-1.52 %
Lotus For Agricultural Investments And Development 0.624
-1.73 %
Rights Issue Of Gulf Canadian Real Estate Investment Co. -1 0.455
-1.73 %
Mohandes Insurance 24.88
-1.82 %
Union Pharmacist 7.61
-1.93 %
Atlas 2.02
-1.94 %
El Kahera Housing 2.18
-2.24 %
El Nasr for Manufacturing Agricultural Crops 40
-2.27 %
Dice 2.57
-2.28 %
Macro Group Pharmaceuticals - Macro Capital S.A.E 2.94
-2.33 %
GTEX For Commercial And Industrial 0.036
-2.7 %
South Valley Cement 7.89
-2.71 %
Misr Cement - Qena 81.4
-2.78 %
October Pharma 201.95
-2.78 %
International Co for Investment & Development 3.82
-3.05 %
Tanmiya for Real Estate Investment 4.1
-3.07 %
Marseilia 4.33
-3.13 %
MB 2.76
-3.16 %
National Co for Housing 67.67
-3.33 %
Alexandria New Medical Center 34.02
-3.46 %
Sabaa 3.81
-3.79 %
Sinai Cement 51.8
-4.27 %
Grand Investment Capital 24.37
-4.32 %
GMC 1.61
-4.73 %
Golden Coast 3.37
-4.8 %
Premium HealthCare Group 0.181
-5.24 %
Arab For Development and Real Estate Development 3.62
-9.95 %
Video Categories
In Brief
A Quick Look On Labor Market In Egypt
Updated 4/27/2023 2:34:00 AM
Copy to clipboard
Tags
Egypt
VideoOfWeek
Labor force
Watch also
World’s Population Reaches a New Milestone in 2022
Returns on Investments Assets in 2022
Non-Oil Private Sector Is It a Real Contributor to the Egyptian Economy?
EGX Performance in 2022
Startups Current Performance & Latest Developments in Egypt
Watch Now
Stay tuned for our exclusive interview with Kevin Holliday, CEO at Venturebeam
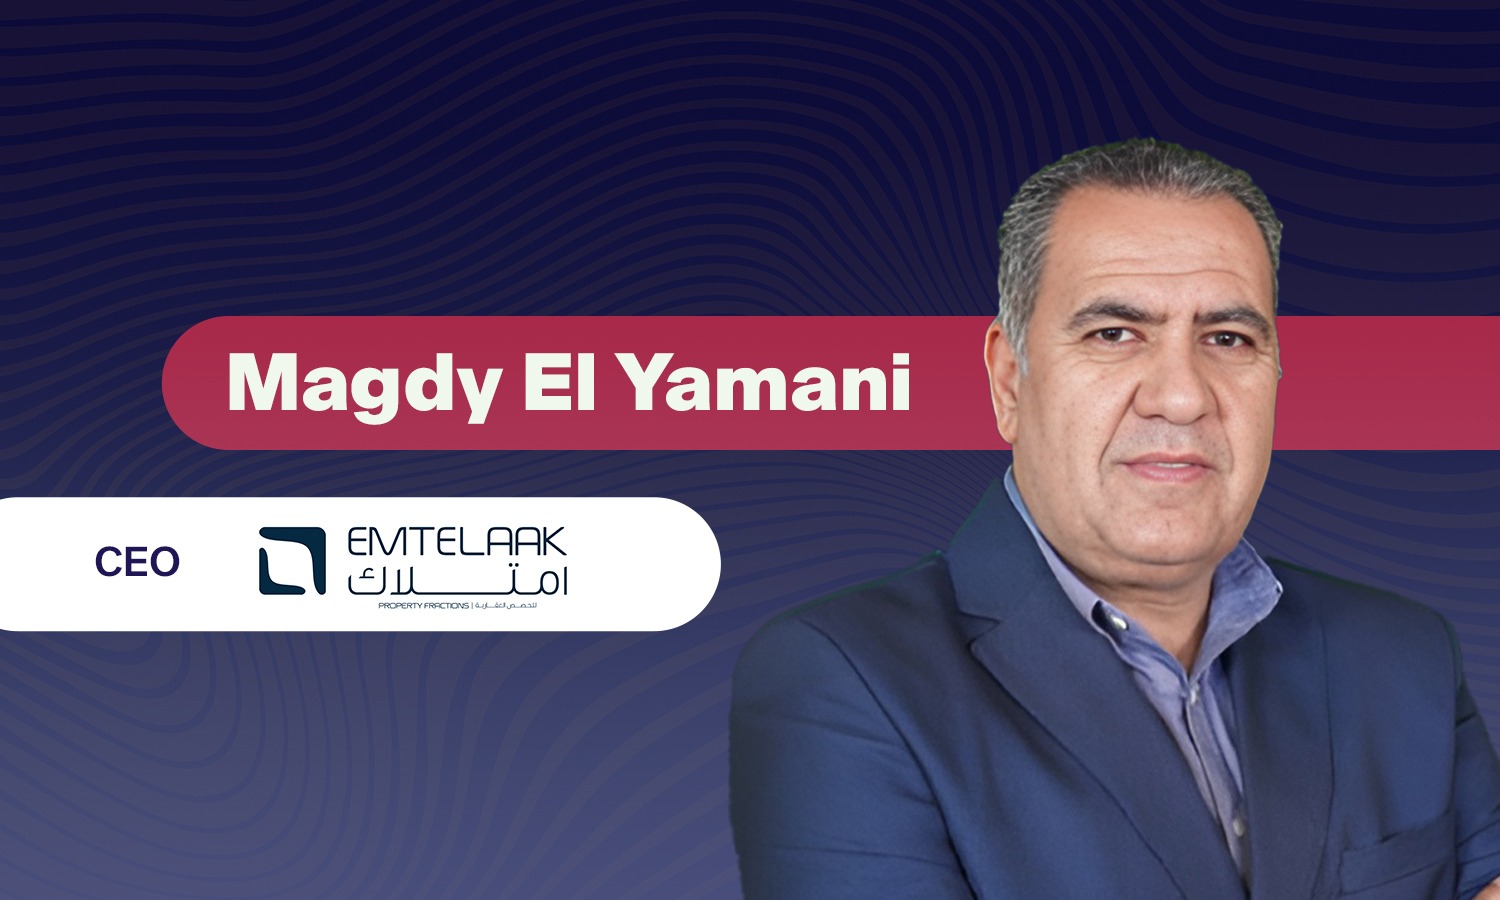
Stay tuned for our exclusive interview with Magdy El Yamani, CEO of Emtelaak
تصريحات حصرية لـ شامل أبو الفضل، الرئيس التنفيذي لشركة بنيان
Trending
Egypt records highest-ever USD resources at $8.5 billion in July: Madbouly
Cabinet approves procedures for old rent tenants to obtain housing units
Cabinet approves AFESD support for Egypt-Jordan electricity interconnection study
SCZONE signs 1st Greek industrial investment in Qantara West at $4M
Cabinet sets supply prices of wheat, cane, sugar beet for 2025/26 season